US employment growth continues to surprise, including where the growth is.

Over the past few months, I have been asking a key question: how long can a few sectors continue to power the U.S. labor market? January’s employment data is beginning to provide some answers.

To start with, US employment continues to rise more than expected. The Bureau of Labor Statistics reported this morning that total nonfarm payroll employment grew by 353,000 jobs in January. Economist had predicted that payrolls would increase 177,000. Payrolls in intangible producing sectors rose by 224,100. In contrast, employment in goods producing sectors was up only 28,000 (23,000 in manufacturing) and tangible services increased by 100,400.

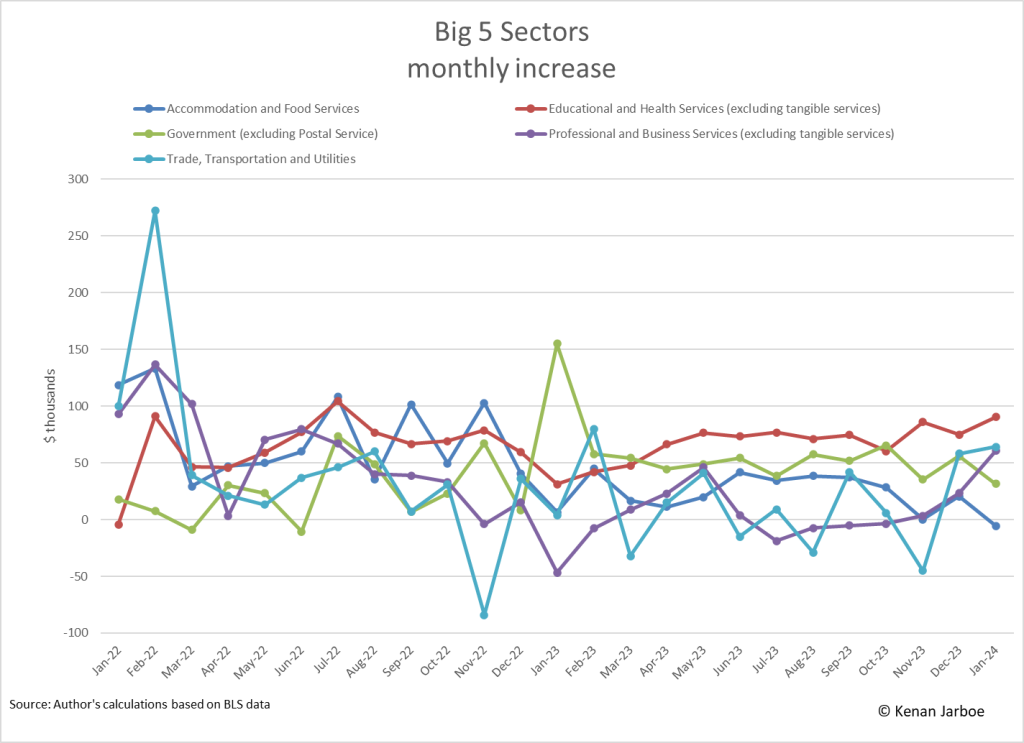
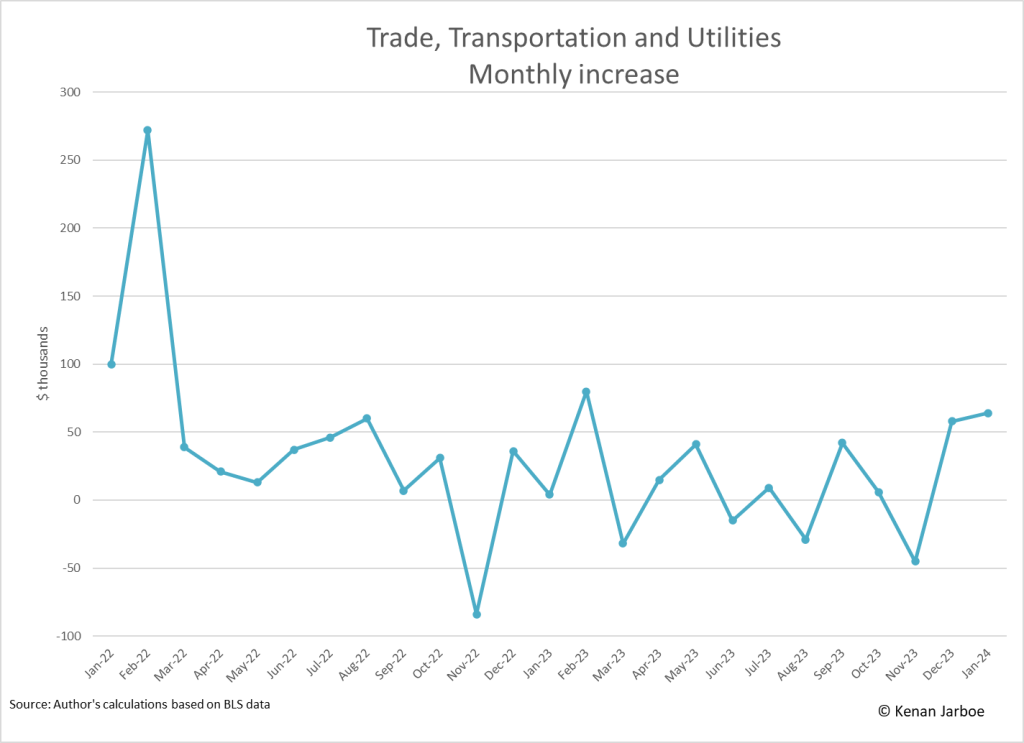
The biggest surprise however came in the shift in which sector were leading the job gains. Educational & Health Services (excluding tangible services) continued to grow, adding a huge 90,400 jobs. And Government (excluding Postal Service) was up by 31,500. But payrolls in the tangible-producing Accommodation & Food Services sector declined by 5,500. In a couple of turnarounds, Trade, Transportation & Utilities added 64,000 jobs and Professional & Business Services (excluding tangible services) grew by 60,700 jobs.

As the charts below show, what we a seeing is continued growth in the key sectors of Educational & Health Services and Government combined with some shifts in other areas. Growth in Accommodation & Food Services has been trending downward and may have peaked. Meanwhile, Trade, Transportation & Utilities and Professional & Business Service have gone up and down and are currently up. We will see over the next few months whether today’s numbers are just a fluke or a true sign of a shift in the economy.

Don’t get excited about services exports at record high

U.S. exports of service exports hit a record level in November. According to trade data released earlier this week, exports of services were $85.7 billion, up $0.6 billion from October (see also news stories). This should not come as a surprise, however. Nor is it particularly exciting news. As the first chart below shows, services export have been steadily growing for the past two decades, except for the pandemic melt down in 2020. But a closer look at the make up of services exports reveals two different stories. And, when looking at international trade in general, there is a large elephant in the room.

I have long argued that there are “services” and there are “services” (see below). The bulk of what is usually called services are sales of intangibles. These include the larger intangible-producing sectors of business services, financial services, insurance services, intellectual property, and telecommunications & information services. The other part of services are tangible services, i.e. those services mostly involved with tangibles. Trade in tangible services is dominated by the movement of goods (transportation services) and people (travel).

The two types of services have differing export histories. Intangible exports have grown steadily over the past 2+ decades. Neither the Great Recession nor the COVID-19 pandemic had much impact on exports.

On the other hand, exports of tangible services dropped dramatically at the beginning of the pandemic and then staged a spectacular recovery. Export of tangible services had been relatively flat pre-pandemic. It remains to be seen if that post-pandemic surge in exports will continue now that they are close to pre-pandemic levels (Transport higher than previous; Travel still behind).

All this to say that we should not get too excited when we are told that services exports have hit a record high. It appears that this trend will continue. Intangible exports continue to grow and tangible services exports continue their recovery.

Turning to the elephant in the room: the overall trade deficit. The US trade balance is overwhelming dominated by the deficit in goods. As the last chart shows, trade surpluses in “services” either intangible or tangible, do not come close to magnitude of the goods deficit.

So, before getting too excited when you hear about services exports, take another look at the data on the overall deficit. It will provide a sobering reality check.

Note: Tangible activities are primarily physical activities (involving atoms); intangibles are primarily information/analytical activities (involving bits). Production of goods is almost exclusively a tangible activity. Services can be divided into tangible and intangible activities. Tangible services involve physical activities such as cutting hair, ringing up a sale at a cash register, cooking and serving a meal, and transporting someone or something. Designing a poster, negotiating a deal, writing an article, and approving a loan are examples of intangible services. For more, see my earlier postings.